
UX Certification
Get hands-on practice in all the key areas of UX and prepare for the BCS Foundation Certificate.

If you compare the UX research methods we use today with the methods we used 16 years ago, something interesting emerges. We see that UX research is becoming increasingly remote and increasingly unmoderated. In other words, we're moving to a world where UX research is becoming automated. We can learn a lot from automated research. But it comes at the price of understanding our users.
In this article, I'll try to predict the future of UX research. To do that, I'm going back to the past. I'm going to show that over the last 16 years or so, UX research has changed.
The good news is that there's a lot more UX research these days. We also have many more UX research methods.
The bad news is that these new research methods don't help development teams understand users.
In fact, I'll show that these new methods actually prevent us understanding user behaviour. They provide an outcome but we don't know the behaviour behind it.
To see how UX research methods have evolved, let's classify them along two dimensions.
The first dimension is whether the method results in skinny data or fat data. Skinny data describe behaviour as numbers it tells us what is happening and fat data describe behaviour as stories and observations it tells us why it's happening.
The second dimension is whether the research is automated. Automated moderation could take the form of a web browser that poses tasks for the participant to complete. It could be text messages that prompt the user to complete a diary entry. It could be a web survey. It could be web analytics or A/B testing.
But each of these automated methods share a common characteristic: the researcher is absent when the data are collected. A UX researcher may still plan the research and analyse the data but they will rarely observe people "live".
So how can these dimensions show us how UX research methods are evolving? 16 years ago I published a book titled E-Commerce Usability. I blew the dust off the book and looked to see the kind of UX research methods I was using at that time.
What I discovered was that pretty much all user research was moderated by a researcher. I can find only two exceptions. One is diary studies, which have a long history in ethnographic research. The other is web analytics but this is prior to Google Analytics, which didn't arrive until two years later. Web analytics in 2003 mainly consisted of web sites proudly displaying a hit rate counter on their home page.
Let's plot the UX research methods of 2003.
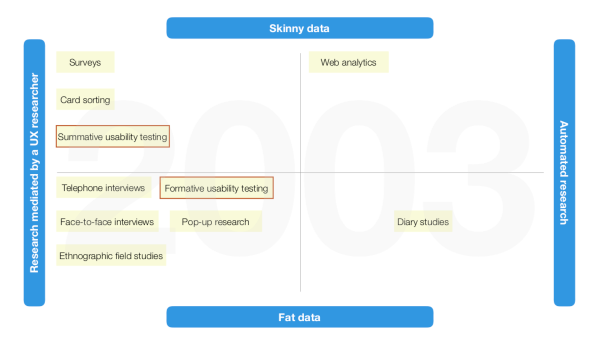
Fig 1: Representative UX research methods from 2003. The majority of UX research methods are moderated by a UX researcher.
In Figure 1, I've highlighted two methods in the diagram: formative and summative usability testing. By formative usability testing I mean "thinking aloud" usability testing. And by summative usability testing I mean collecting metrics, like success rate and time on task. You'll see from the diagram that both of these started as non-automated test methods. I'll be coming back to these methods in a moment.
My most recent book, co-authored with Philip Hodgson, was published a few months ago. I thought for comparison, I'd plot the methods we use today on the same diagram.
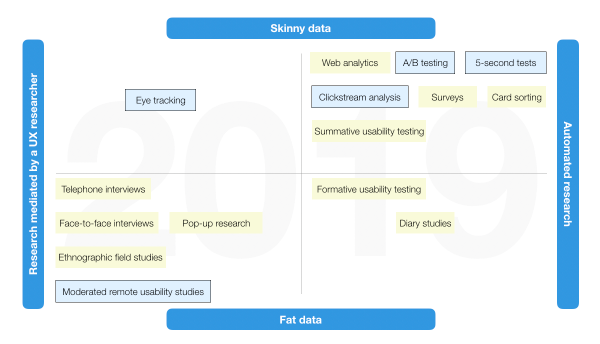
Fig 2: Representative UX research methods from 2019. Most new UX research methods are automated and some classic UX research methods are becoming automated.
The newer methods (shown in Figure 2 in blue and with a border) are methods that didn't even exist 16 years ago, because the technology wasn't in place. You'll also notice that they are predominantly in the top right of the diagram. This is where automated research methods plot.
You'll notice something else interesting from this diagram. Classic research techniques like usability testing, surveys and card sorting have moved to the automated quadrants too.
When you automate a formative usability test, a participant video records themselves while carrying out tasks with a web site. No-one watches it live. The video gets uploaded to the cloud for the development team to watch afterwards.
When you automate a summative usability test, participants are sent to a web site and instructed by the computer to carry out various tasks. The computer measures time on task and an algorithm determines if the user was successful or not.
The diagrams show that both new UX research methods and classic UX research methods are becoming increasingly automated. This trend will only continue, for at least 5 reasons.
I must have missed the meeting where someone decided this was the future direction of UX research. We should at least have a good look and decide if this is the future we want.
Take a research method like a survey. Even though you're asking fixed questions (and collecting skinny data), if you administer a survey on the telephone, you at least get an insight into the questions people are struggling to answer. You hear the umms, ifs and buts in their voice. These umms, ifs and buts are fat data. When we recast a survey as a remote, automated method (for example, by delivering it on SurveyMonkey) we lose the fat data points. Participants edit out the umms, ifs and buts when they type in their answers.
Take another research method like a summative usability test. This is a metrics-based test, but in the past the UX researcher would still observe the participant through the one-way mirror. That means the researcher would see where the user struggled. Those observations complemented the metrics. When you automate the test, you lose those insights. You just end up with a spreadsheet.
To use a sporting analogy, observing your users live is like watching a live football game. Imagine you're in the crowd at Wembley watching two teams in the cup final. You don't just watch the game: you're part of the game. You're involved for 90 minutes.
When we ask users to video record themselves using a web site, as in the new style of formative usability test, it's like watching the highlights of a football game. You'll skip the less interesting parts and fast forward to the moments of interest. If someone tells you the game is boring, you may not even watch the video at all.
And when we fully automate a summative usability test, it's like looking at the football scores in the Sunday newspaper. We get the results but we miss the experience.
When you automate research you apply blinkers to your design process. You see the ends but not the means. Automated methods move you further from users, not closer to them. You get an outcome but you don't know the behaviour that got you there.
You might think that's OK. It's all about outcomes. But it's not. When you focus on outcomes and ignore behaviour, you get revenge effects.
Here's an example of a revenge effect I came across recently. In the game Pokémon Go, you collect Pokémon eggs that you then need to hatch. The game designers decided that to hatch eggs, players would need to walk around with their mobile phone. What a great way to encourage people to exercise!
The game counts your steps and you hatch an egg for every few kilometres you walk. Only instead of actually exercising, some people use these devices (see Fig 3) to cheat the system.
Fig 3: How to game a step counter
We think we're manipulating behaviour but it turns out people are manipulating the numbers. A number is not a behaviour. We need to accept that skinny data provide a one-dimensional view of user behaviour. You get the result but you miss the experience.
We need face-to-face research to provide an empathic view of users. Empathic research gives you insight into the "why?" behind the user's behaviour.
What does "good quality" UX research look like? Well, it's not necessarily about numbers. Numbers are one way to understand the world. Hearing stories about people's experience is another. Neither one is better.
Nor is it about statistical significance. Psychology is in the midst of a replication crisis: researchers have been unable to repeat many of the classic experiments of the past. Those classic experiments were statistically significant but this was achieved by p-hacking: essentially, this means torturing the data until they said something interesting.
And it's definitely not about your sample size. You can do poor quality research with 1000 users and you can do good quality research with 5 users. There are many situations where talking to a handful of people for 5 minutes will give you a lot more useful information than surveying thousands.
So what does define good quality UX research? Good quality UX research is research that provides actionable and testable insights into users' needs.
This isn't about one research method being better than another. It's about triangulation. Triangulation is the combination of research methods in the study of the same phenomenon. Automated methods generally tell us what people are doing. Moderated methods generally tell us why people are doing it. With user research, it's best to have a combination of the two.
Picture your development team in your head. If it's anything like the teams I work with, it's probably unrepresentative of your target audience. I bet virtually all your team members are university educated, tech-literate and young.
Most of them are probably white, male and cis-gendered or at least the ones who make the important decisions.
Not many of you have a team member who's blind, in a wheelchair, on benefits, homeless or with mental health issues.
A development team is the very definition of a mono-culture.
This bias prevents them from taking the user's perspective. You won't overcome those biases with automated research.
You will overcome those biases with research methods that get your team observing real people achieving their goals.
-oOo-

Dr. David Travis (@userfocus) has been carrying out ethnographic field research and running product usability tests since 1989. He has published three books on user experience including Think Like a UX Researcher. If you like his articles, you might enjoy his free online user experience course.

Gain hands-on practice in all the key areas of UX while you prepare for the BCS Foundation Certificate in User Experience. More details

This article is tagged ethnography, iterative design, strategy, usability testing.
Our most recent videos
Our most recent articles
Let us help you create great customer experiences.
We run regular training courses in usability and UX.
Join our community of UX professionals who get their user experience training from Userfocus. See our curriculum.
copyright © Userfocus 2021.
Dr. David Travis (@userfocus) has been carrying out ethnographic field research and running product usability tests since 1989. He has published three books on user experience including Think Like a UX Researcher.
Get hands-on practice in all the key areas of UX and prepare for the BCS Foundation Certificate.
We can tailor our user research and design courses to address the specific issues facing your development team.
Users don't always know what they want and their opinions can be unreliable — so we help you get behind your users' behaviour.