
UX Certification
Get hands-on practice in all the key areas of UX and prepare for the BCS Foundation Certificate.

Here are 6 steps for benchmarking your user experience designs against your client’s business objectives. The same approach works whether your clients are internal to your organisation or external. The approach works for web sites, mobile apps, desktop software, intranets, consumer products, even services.

Photo by chuttersnap on Unsplash.
Most designers have fairly strong opinions about what makes a good design and what makes a bad design. Those opinions are based on experience with previous projects as well as a ‘design sense’ or design aesthetic. Any designer worth his or her salt can usually look at a product or web site and identify at least one mistake in its design.
One of my favourite web sites is Anne Holland’s ‘Which Test Won’. Every couple of weeks, Anne presents you with a pair of alternative web page designs and asks you to decide which one is best. For example, one design may have the word ‘Search’ written on a search button; the other design might have the same word written in the search field. You vote on which design you think is best.
What makes the site interesting is that Anne knows the answer. This isn’t because she’s a guru designer but because she has the results from an A/B test. With an A/B test, half of your users see the first design and the other half see the alternative design. You then look at the results and see which one met your business objective: for example, which design increased revenue per visitor?
Sometimes I get the answer correct. But other times I get the answer wrong. When I get the answer wrong I look back at the two designs and I can usually convince myself why I got it wrong. Once I know the answer, it’s obvious why version A or version B did best: hindsight, as they say, is 20/20 vision.
The truth is, few designers ever put their design to the test.
There’s a better way.
Good designers benchmark their design decisions against business objectives: does the design make the product more or less successful? Justifying your design in any terms other than the client’s business objectives is a fundamental design mistake.
Here are 6 steps for benchmarking your user experience designs against your client’s business objectives. Not only will these steps help you please your clients but you’ll find you work more productively because you only carry out design activities that really make a difference.
The steps are:
If we’re going to prove relevance, we first need to work out what we’re relevant to. In this step you’ll articulate the business objective behind the product, service or web site that you’re developing. In some cases the business objective will be obvious: for an e-commerce site it might be sales; for a web site selling professional services it might be the number of people who sign up for an email newsletter; for a firm that develops software, it might be the number of people who upgrade to the paid version of a product after downloading the trial version.
If you’re not sure, the rule of thumb is to follow the money. Ask: “How does the organisation make or save money with this product?” For example, for a charitable web site it might be the number of people who make a donation; for a web site that exists solely to promote a brand it might be the number of Facebook ‘likes’; for a government web site it might be the number of citizens who access an online service more than once. If you’re still unsure, then check with the product manager or other stakeholders in the organisation.
Don’t proceed until you have a business objective that is actionable and auditable, like the ones above. A business objective like “Be the number one brand in the social space” is meaningless.
In this step, you need to think about the key UX factors that impact the business objective.
To make this more concrete, let’s take a specific example of a project we worked on recently: this was an estate agent’s (realtor’s) web site. The client had a very clear business objective: they wanted to sell their inventory of houses more quickly. The goal of the web site in this process was to increase the number of people requesting a viewing, since the more people that view a house, the more likely it is to sell. That’s our business objective.
Now we can generate some theories for improvement. Let’s examine the web site and consider the possible UX factors that affect the business objective. We’ll probably need to do some initial research — for example, we could find people who used the site but didn’t request to view a house and ask them why, or we could send an online survey to a sample of house purchasers. Then we’ll have some confidence that these are the right UX factors to focus on.
For example, we might decide that the following UX factors directly impact the business objective:
Note that these UX factors are assumptions. Although they seem sensible, we don’t know for sure that improving them will lead to an increase in the number of people that want to view houses. I’m reminded of a story that Eric Ries tells in ‘The Lean Startup’. Designers at the Grockit web site assumed that changing the registration process to support ‘Lazy Registration’ would result in more people using the service. (Lazy Registration is a clever way to let people try out a site before they sign up. You allow people to use all of the core features and even save their data. When they eventually sign up, all of their data is transferred to the new account.)
The designers at Grockit did a test. They compared a group of users who experienced Lazy Registration with another group of users who couldn’t use any functionality until they signed up. If we follow best practice, we’d predict that the Lazy Registration group would do better. In fact, the designers did a test which showed that (for their site) Lazy Registration had no impact on registration, activation and subsequent retention.
This doesn’t mean that Lazy Registration isn’t a good idea in general. It just wasn’t a good idea for Grockit in particular. This makes the point that your UX factors are assumptions that we need to test. The alternative is to spend weeks improving the ability to easily search for houses by price and location (say) only to find it has no impact on the business objective.
Now, as we move into the design process, we need to think about the specific UX activities that we need to carry out in order to meet our UX objectives. This provides us with a roadmap for design research that we can use to guide development with the UX factors our signposts along the way. The UX activities make the priorities of the release very clear to everyone on the design team.
Assuming that we’ve identified the right UX factors to influence the business objective, we now have a set of criteria to guide development sprints. For example, one of the UX factors above is ‘The ability to easily search for houses by price and location’. This helps the design team focus on what’s important.
I’ll admit, at the moment, this attribute isn’t very well defined. For example, what does ‘easily search’ mean? We certainly need to firm this up. But right now, it’s still clear enough to help us understand where the product priorities lie. The priority is making it easy to search for houses by price and location, not (say) creating a customised PDF download of the house details. This leads to specific ideas for UX activities: for example, we’ll run a usability test to find where the roadblocks are with the house search process. This will provide us with a list of usability bugs that we need to fix to improve the search experience.
In this stage, we’ll derive some values we can use to assess current performance. Tables 1 and 2 show some (simulated) data from a test that we can use to make the point. (Note that these tables use four participants, simply to make the table easier to read. In an actual benchmark test, you’ll want to use a larger sample size: typically, around 20 users).
| User | Task 1 | Task 2 | Task 3 | Task 4 |
|---|---|---|---|---|
| User 1 | Pass | Pass | Pass | Pass |
| User 2 | Fail | Pass | Pass | Fail |
| User 3 | Fail | Pass | Pass | Pass |
| User 4 | Pass | Pass | Fail | Pass |
| Success rate | 50% | 100% | 75% | 75% |
Each cell shows whether a user passed or failed the task.
For example, let’s say that Task 1 is our ‘Search for houses by price and location’ task. We can see that only 50% of people complete this task successfully. We can now set a realistic target for improvement — for example, in the next release, we might expect 75% of users to be able to complete this task.
There are other measures we can take from this table: for example, Task 1 looks like it needs a bit of work, whereas Task 2 is doing well. We could also calculate the overall task completion score by dividing 12 (the number of successful task completions) by 16 (the total number of tasks) and get a percentage of 75%.
We can do a similar analysis of task times.
| User | Task 1 | Task 2 | Task 3 | Task 4 |
|---|---|---|---|---|
| User 1 | 320s | 485s | 280s | 520s |
| User 2 | 425s | 260s | ||
| User 3 | 1230s | 320s | 580s | |
| User 4 | 285s | 430s | 490s | |
| Geo mean | 302s | 575s | 286s | 529s |
Each cell shows the time taken to complete the task. (Some cells are blank because those users never completed the task).
Again, let’s assume that Task 1 is our ‘Search for houses by price and location’ task. We can see that searching for a house takes an average of 302s or about 5mins. We can now set a realistic target for improving this — for example, let’s see if we can speed up the search process so it’s completed in 3 mins.
(Note: Simply reducing time on task is one way of tracking design progress. Another way of expressing time on task improvements is by comparing the time taken by test participants with the time taken by trained, expert users. This is one way of being able to express time on task improvements as a percentage.)
Now, in this pre-design phase, we have some benchmark values in place to know if we’re moving forwards or backwards with our designs.
At this point, we can start testing our assumptions. We create new versions of the web site and test each one with users. At each stage, we see if we’re getting closer to our target value or not.
To track progress, we can apply a traffic light system: for example, a red light if we’re well below the target; a yellow light if we’re close to the target; and a green light if we’re on target.
The example below shows an example of this kind of benchmark report we did a while back for a web site.
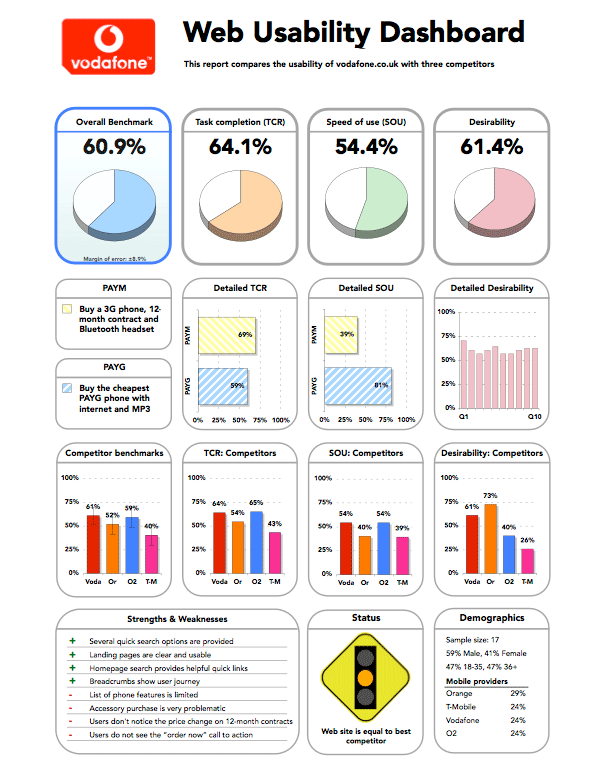
The figure shows an example of a benchmark usability report for a web site. The report includes the three key measures of usability — effectiveness, efficiency and satisfaction — and combines these into an overall benchmark score to track progress.
Ultimately, we need to tie our testing back to the business objective. Although it may seem obvious that we’ve improved the web site because we’ve improved performance on the UX factors, this is still a circle that needs closing. And the best way to close the circle is to return to where we started: we’ll run an A/B test.
In our example, Version A is our original release. Version B is our version with a UX improvement — for example, we’ve improved the ability to easily search for houses by price and location. It’s important that Version B doesn’t also include lots of new features or other major changes, because if it does, we’ll never know if the improvement was due to improving the search process or because of some other factor.
The best way to do this is to make the change quickly, release it and then test to see if the change improved the business objective. This may mean you make changes to the software and run tests on a weekly or even a daily basis (depending on the traffic you get).
When I speak with clients these days, I can see that most of them value design. At the very least, design is usually a step in their development process and not just something that happens on a whiteboard over a coffee.
But this doesn’t mean clients will value your design aesthetic or your opinion on what makes good or bad user interfaces. Probe deeper and you’ll see that the value of good design lies in the business benefits: good design creates more successful products.
Try this 6-step method to prove the business benefit of your own UX work.
Find out more on our 3-day, user experience immersion seminar.

Dr. David Travis (@userfocus) has been carrying out ethnographic field research and running product usability tests since 1989. He has published three books on user experience including Think Like a UX Researcher. If you like his articles, you might enjoy his free online user experience course.

Gain hands-on practice in all the key areas of UX while you prepare for the BCS Foundation Certificate in User Experience. More details

This article is tagged metrics.
Our most recent videos
Our most recent articles
Let us help you create great customer experiences.
We run regular training courses in usability and UX.
Join our community of UX professionals who get their user experience training from Userfocus. See our curriculum.
copyright © Userfocus 2021.
Dr. David Travis (@userfocus) has been carrying out ethnographic field research and running product usability tests since 1989. He has published three books on user experience including Think Like a UX Researcher.
Get hands-on practice in all the key areas of UX and prepare for the BCS Foundation Certificate.
We can tailor our user research and design courses to address the specific issues facing your development team.
Users don't always know what they want and their opinions can be unreliable — so we help you get behind your users' behaviour.